Contest Details
|
Band
|
QSOs
|
Ctys
|
Callsign Used: | K3PP | |
|
160m
|
37
|
32
|
Operator(s): | K3PP | |
|
80m
|
106
|
59
|
Operator Category: | Single-Op Assisted | |
|
40m
|
174
|
76
|
Band: | All | |
|
20m
|
1026
|
112
|
Power: | High | |
|
15m
|
147
|
51
|
Mode: | SSB | |
|
10m
|
33
|
15
|
Logging Software: | N1MM Logger v9.2.5 | |
|
ALL
|
1523
|
345
|
Club: | Frankford Radio Club |
| Claimed Score: | 1,571,130 | |
| Published Score: | 1,528,740 | 2.7% UBN Reduction (that's very good, by the way!) |
| Number 6 SOA in W/VE!! My fifth Top Ten finish!! SO1R!! | ||
|
Final Results Published in the September 2009 issue of QST:
|
||||||
| Place | Call | Score | QSOs | Mults | Section | Club |
| 1 | W2RE | 3,272,328 | 2,918 | 376 | ENY | Hudson Valley Contesters and DXers |
| 2 | NN3W | 3,060,288 | 2,484 | 414 | MDC | Potomac Valley Radio Club |
| 3 | VY1TT | 3,013,644 | 2,832 | 358 | MAR | Southern California Contest Club |
| 4 | K3WW | 2,305,422 | 2,055 | 378 | EPA | Frankford Radio Club |
| 5 | AA3B | 1,975,446 | 1,822 | 363 | EPA | Frankford Radio Club |
| 6 | K3PP | 1,528,740 | 1,499 | 342 | EPA | Frankford Radio Club |
| 7 | VA3DX | 1,436,400 | 1,589 | 304 | ON | Contest Club Ontario |
| 8 | N8TR | 1,409,628 | 1,310 | 362 | OH | North Coast Contesters |
| 9 | K2PLF | 1,358,775 | 1,491 | 305 | MDC | Potomac Valley Radio Club |
| 10 | N3AD | 1,251,747 | 1,298 | 333 | EPA | Frankford Radio Club |
| Antennas: | |
|
160m
|
Inv-L with top at 60 ft. and base at 8 ft. with two elevated radials |
|
80m
|
Half-wave sloper from 60 ft to 10 ft sloping toward Europe |
|
40m
|
Dipole at 40 ft. |
|
20m
|
4 element Force-12 EF-420 monobander at 68 ft. |
|
15m
|
4 element Force-12 EF-415 monobander at 76 ft. |
|
10m
|
4 element Force-12 EF-410 monobander at 84 ft. |
Soapbox Comments:
I was unable to dedicate much time to the CW running of the ARRL DX Contest in 2009 because I had to board a plane on Sunday for a business trip to Edinburgh and Paris. I made sure to reserve the SSB weekend for a stonger effort and business demands were a bit more conducive for this. I still had to make sure I got my sleep both nights, though because I had to be in New York for some business meetings on Monday.
I spent most of the Friday leading up to the contest to rebuild my damaged antennas for 80m and 160m. Had I been able to play more during the late night hours, I would have produced much better numbers on these bands. Both antennas performed very well. It was particularly satisfying to work stations on 160m that I never would have made on my former Inv-V. I am excited to see what I can work on 160m with this new antenna. In this contest alone, I picked up 7 new countries on 160m. I also added two on 80m.
Highlights:
- During my Saturday afternoon 20m run on 14.169 MHz, Gerrit PD3GO called me for a QSO. In one of those "welcome to the new age of radio" moments, Gerrit sent me an email message three minutes later to inquire about a direct QSL!
- The final published results placed me at #6 in the single-operator assisted (SOA) category in the US and Canada, out of a field of 358 entries! Worldwide, I was #9 out of 493 published scores. This sounds even more impressive, but the scoring in this contest favors stations in the US and Canada (W/VE), since we can get more multipliers. To beat a US station's score, you need to put in a phenomenal effort. For example, ZX2B beat me for #8 with 1,876,980 to my 1,528,740 points but needed 2,892 QSOs to top my 1,499 QSOs. I had 342 multipliers, whereas he could only muster 218. We in W/VE simply have more potential mults to choose from! Congratulations Wanderley! Muito bem!
K3 Performance Plot:
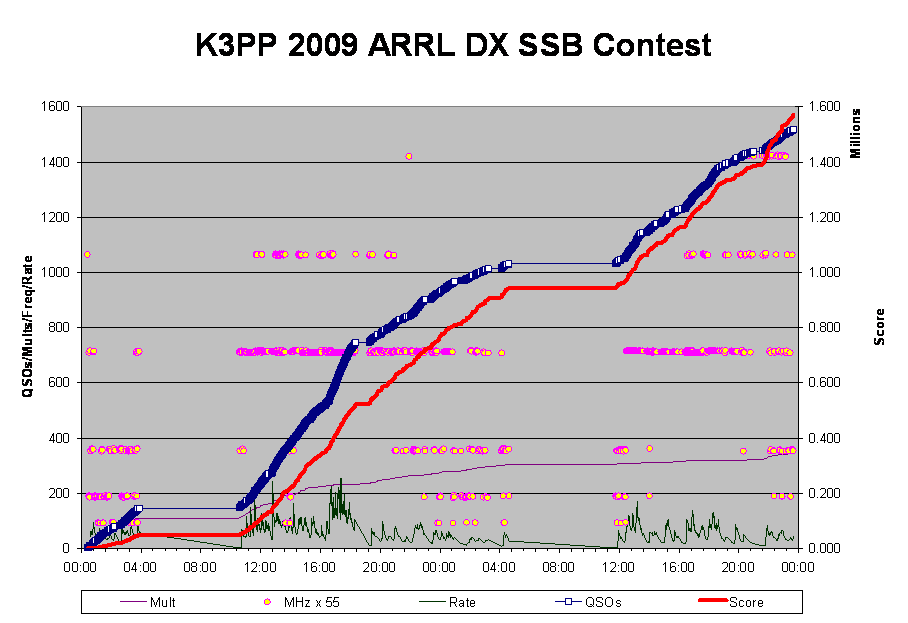
The chart below is my Performance Plot for the contest. I developed this plot in Microsoft Excel several years as a graphical aid in analyzing contest performances.
Here is what the Performance Plot shows:
- The thick red line is the score
- The dark blue line with the boxes shows the QSOs. Note how at high rates, the boxes squeeze together to form a solid thick blue line. The appearance of white in the boxes means my rate was not great/ I don't like white space on this line!
- The rate itself is plotted by the dark green line. The peaks in the rate naturally correlate with a steeper slope in the QSO line and the score grows faster, of course. High rate is a beautiful thing!
- The purple line shows the multipliers. Note that my score grew rapidly near the ned of the contest. My rate was not great during this period, but I was catching lots of new multipliers that contributed to this surge.
- The final data shown is the frequency, indicated by the pink and yellow bubbles. Here again, you can see an interesting visual effect of running stations at a high rate. The frequency bounces around during Search & Pounce mode, but a run sits on the same frequency for longer periods. A run can be seen as a straight horizontal "smear" of the bubbles. If the rate is good, you should see no yellow.
Rate Graphs:
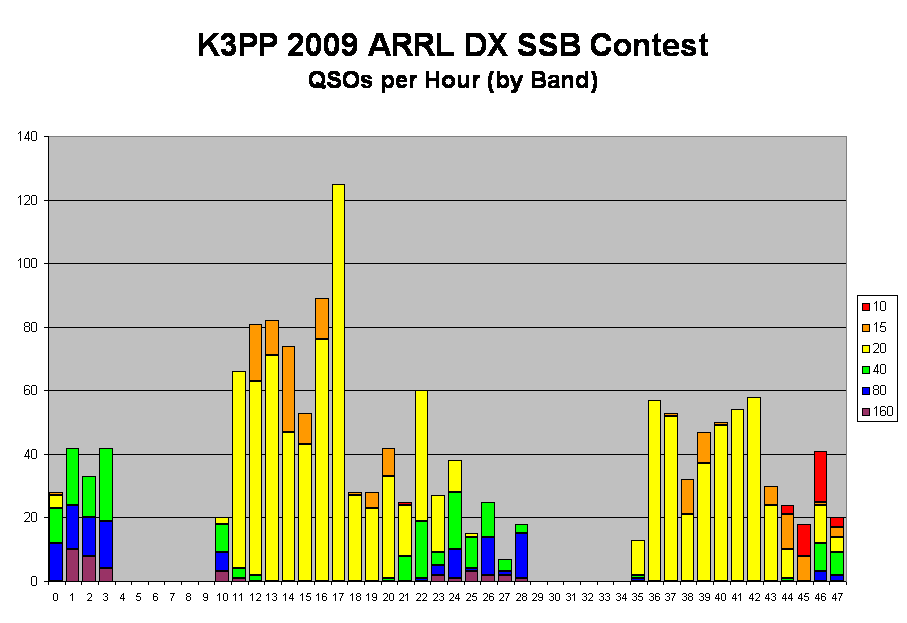
The graph below shows my hourly rates broken down by band. The yellow bars indicate 20m, so you can easily see how 20m dominated this contest.
Here is what the Performance Plot shows:
